Measuring the Sodium Doublet
Welcome to the Sodium Doubletproject page hosted by Walla Walla University. This project was developed and is maintained by Dr. Tom Ekkens. If you have comments or suggestions please send email to tom.ekkens@wallawalla.edu. This page was last updated on July 7, 2021.
For a number of labs, we want to measure (and resolve) the sodium doublet. The D-Lines are at 588.995 nm and 589.5924 nm. This gives us an average value of 589.2 nm and a separation of 0.597 nm. If we use the revision 6 SpectraCamwhich has a resolution of 0.6 nm, we can only see a single bright line.
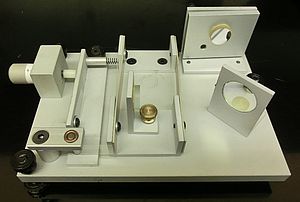
Themethod described here makes use of the beats between the two close frequencies to measure the distances between the constructive and destructive light patterns. We can use the equationΔλ =λ2/2dto solve for the distance between two constructive spots. Using the numbers from above, the distance is 0.291 mm. The goal is then to measure that displacement using an interferometer. While we could construct our own interferometer, the Pasco OS-8501 is available for purchase. The only problem is that the interferometer moved by the micrometer knob shown in the picture below and it only makes 8 turns of 20 um for a total displacement of 0.16 mm.
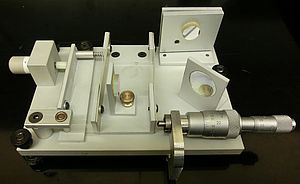
The solution is to add another micrometer to the empty area in the lower right of the picture. The micrometer is held in place by a piece of aluminum. The micrometer shown is a differential micrometer but the fine adjustment was not used for this experiment. The micrometer can move the mirror by 2-3 mm.

The dimensions on the aluminum holder depend on the specific micrometer used and are not very critical. The dimensions for my piece are shown in the picture below. The aluminum piece is 6.35 mm thick (¼” flat stock) and the lower holes were threaded for 6-32” bolts. While not shown in the drawing, the corners were rounded for aesthetic reasons only.
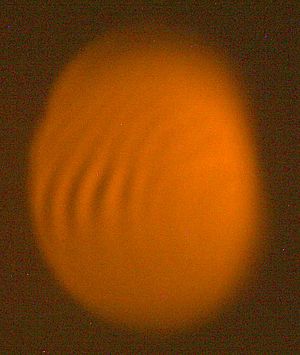
In practice, the best way to collect the data is to read the position from the micrometer and just look for the interference pattern to go from uniform yellow to strong interference lines. In the picture at the right, the strong interference lines are clearly visible and as the position is changed, the entire spot will look like the uniform color at the bottom of the picture.
I measured 6 cycles from strong pattern to no pattern and then backto strong pattern. The average distance from strong to strong pattern is 0.292 nm with a standard deviation of 0.05 nm. This matches the expected values very well.